All code developed in the lab that we have put in the OpenSource domain can now be seen on GITHUB under Cycles lab
Bacterial cell size analysis in Phase contrast: Detection of cell lengths and widths of rod-shaped (maybe also curved) cells from phase contrast images: MATLAB based code that uses many of the commonly used methods. It requires the latest release of MATLAB and the ImageProcessing and distance metric toolboxes.
Please cite the DOI above if you use the code.
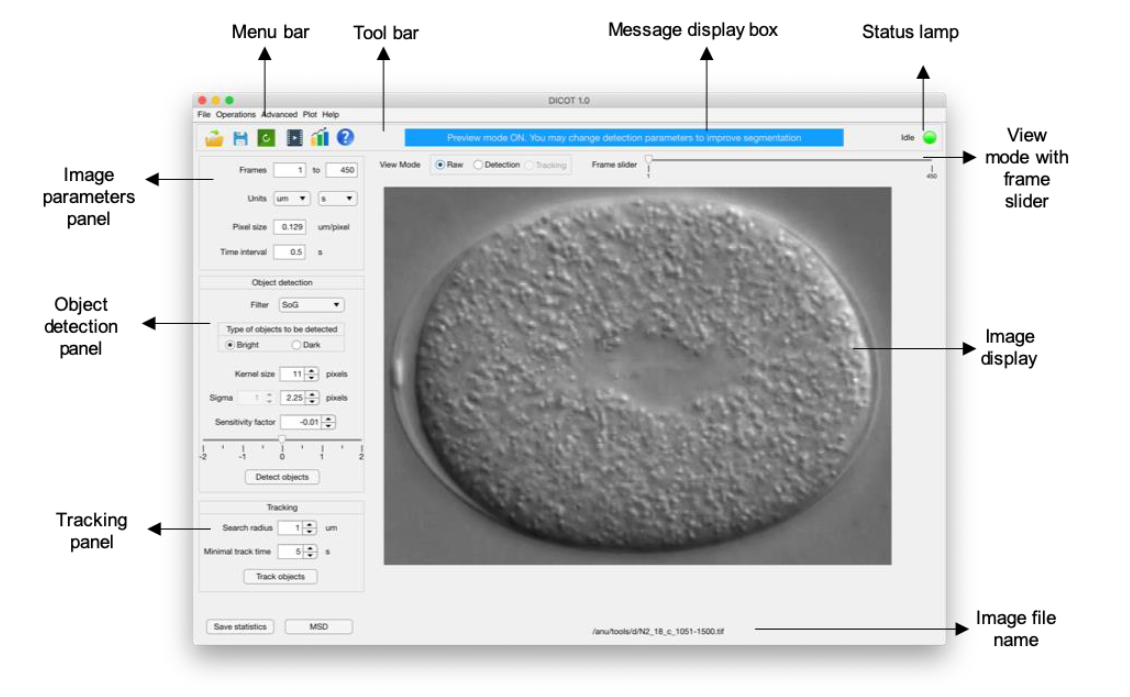
DIC object tracking (DICOT) with a GUI programmed in MATLAB for segmentation and single particle tracking (SPT) of intracellular mobility.
The work is related to a published Computational Tool paper in the Biophysical Journal. Reference:
Anushree R. Chaphalkar*, Yash K. Jawale*, Dhruv Khatri, Chaitanya A. Athale (2021) Quantifying Intracellular Particle Flows by DIC Object Tracking. Biophysical JournalVolume 120, Issue 3, 2 February 2021, Pages 393-401 paper on the journal site. In case the PDF is not accessible please do not hesitate to write to us.

Growth rate and cell size distributions. (a) The growth (log10 cell density) of E. coli MG1655 cells was measured as a function of time in the following growth media: LB (black), yeast extract broth (YEB) (red), tryptone broth (TB) (green), M9 media supplemented either with glucose (blue), succinate (brown) or acetate (purple). Samples taken from the mid-log phase (circles) (b) (left) were examined in DIC microscopy (scale bar, 5 µm) and (right) the cell length distribution (bars) plotted. The distribution was fit to lognormal (red) where μ: mean cell length, v, variance; n, total number of cells. dmax is the Kolmogorov–Smirnov test value evaluated for the fit.
Rod-shaped bacterial cell length analysis in MATLAB- automated routine. Needs parameter optimization. Image-mode: differential interference contrast (DIC). [github-code] [Ref: Manasi S. Gangan
and Chaitanya A. Athale (2017) Threshold effect of growth rate on population variability of Escherichia coli cell lengths https://royalsocietypublishing.org/doi/full/10.1098/rsos.160417]
The interface to the program AMTRaK as described in the PLoS ONE report by Chaphalkar et al.
AMTraK: An improved kymograph generator and analyzing program. Writen in a MATLAB using some of the ImageProcessing library toolbox functions. Also available as a bundled program. More details also in our paper:
Chaphalkar AR, Jain K, Gangan MS, Athale CA* (2016) Automated Multi-Peak Tracking Kymography (AMTraK): A Tool to Quantify Sub-Cellular Dynamics with Sub-Pixel Accuracy. PLoS ONE 11(12): e0167620. doi:10.1371/journal.pone.0167620
Rosette plot by Chaitanya Athale (2008) for MATLAB. This simple plotting tool uses the rose plot (popular in circular statistics) to plot frequencies of known period in a circular manner.
ImageJ batch converter: This code was written because of a constant need to renumber, rename and copy into new formats large clusters of image-files from microscopy. Feel free to use it and let me know if you find bugs. Certainly if you improve on it, do please let me know. [CODE]


